Scientific Survey Shows Voters Across the Political Spectrum Are Ideologically Deluded
April 16, 2021

During the late 1800s when the renowned scientist Louis Pasteur was trying to overturn the medical community’s deadly belief that germs are not communicable, he wrote: “The greatest aberration of the mind is to believe a thing to be, because we desire it.” The results of a scientific survey conducted just after the 2020 presidential election show that voters from across the political spectrum have failed to heed that warning.
The survey, commissioned by Just Facts, reveals that the vast bulk of voters have embraced false and harmful dogmas that accord with their political views. This is a typical consequence of confirmation bias, the human tendency to reflexively accept anything that accords with one’s preexisting beliefs and ignore or twist everything that defies them.
While most polls measure public opinion, this annual scientific survey measures voters’ perceptions of issues that can have major impacts on their lives. This year’s survey used an entirely new set of questions that addressed the topics of Covid-19, income, poverty, racial disparities, global warming, drug overdoses, life expectancy, pollution, and the national debt.
Some illuminating examples of the misconceptions held by voters with differing political preferences include the following:
- 76% of Trump voters think that the average income of middle-income households fell during the Obama administration. In reality, their inflation-adjusted average income rose by $5,300 during this period.
- 88% of Biden voters think that police are more likely to use lethal force when arresting black people than white people. In reality, police are 42% less likely to use lethal force when arresting blacks than whites.
The survey also found that a considerable portion of Trump voters have adopted some progressive fallacies spread by the media. For instance, 38% of Trump voters (and 86% of Biden voters) think that the number of strong-to-violent tornadoes in the U.S. has generally increased since the 1950s. In reality, they have slightly decreased.
That disconnect between fact and perception accords with numerous reports that link tornadoes and other extreme weather events to global warming, even though such events have occurred at a roughly level pace for as far back in time as reliable data extends. This suggests that progressive powerhouses like media titans, big tech corporations, and educational institutions have enough reach and influence to mislead large numbers of people who are ideologically opposed to falsehoods they propagate.
The survey was comprised of 21 questions posed to U.S. residents who regularly vote. It was conducted just after the 2020 presidential election by Triton Polling & Research, an academic research firm that applied scientific survey methods to optimize accuracy.
Results for All Voters
For each question, voters were offered a selection of two or more answers, one of which was true. Voters also had the opportunity to say they were unsure.
On average, voters gave the correct answer 38% of the time, gave an incorrect answer 51% of the time, and said they were unsure 10% of the time.
A majority of voters gave the correct answer to only 4 of the 21 questions.
Results by Ideology of Falsehood
Among questions in which the wrong answers accorded with partisan agendas, an average of 57% of answers were liberally misinformed, while 28% were conservatively misinformed. In other words, voters were twice as likely to believe certain progressive myths than conservative ones.
For all 10 of the questions in which the electorate was most deluded, the wrong answers they gave concurred with progressive narratives propagated by the media. Moreover, the false answers they gave were often far removed from reality, not just slightly mistaken. For example, 66% of voters thought that doubling the federal minimum wage to $15 per hour would raise the average income of families in poverty by 25% or more. The real figure is about 1%.
Results by Politics, Age, and Gender
The survey also recorded voters’ ages, genders, and who they voted for in the presidential election. This allows the survey to pinpoint the segments of society that are most and least informed about specific issues. The sample size of third-party voters were too small to produce meaningful data.
The results show deep partisan and demographic divides, with different groups being more or less knowledgeable depending upon the questions.
On average, the rates at which voters gave false answers varied from 61% for Biden voters to 42% for Trump voters. From worst to best, the false answer rates for the various groups are as follows:
- 61% for Biden voters
- 56% for 18- to 34-year olds
- 53% for females
- 51% for 35- to 64-year olds
- 51% for 65+ year olds
- 49% for males
- 42% for Trump voters
All of the questions, the correct answers, and the full survey results and methodologies are detailed below. The survey was conducted on November 4–11, 2020.
Covid-19
Question 1: The first known Covid-19 death in the U.S. occurred in early February of this year (2020). Since then, what portion of all deaths in the U.S. do you think have involved Covid-19? About 1%, 10%, or 50%?
Correct Answer: About 10%
From early February 2020 to when the survey was conducted in early November 2020, the CDC’s National Center for Health Statistics recorded 241,129 deaths involving C-19 and 2,449,346 deaths from all causes. This means that 10% of deaths involved Covid-19. By mid-March 2021, the figure had risen to 15%.
Fatal interactions between Covid-19 and other ailments like heart disease and diabetes make it difficult to determine the exact death toll from C-19. A range of evidence suggests that the CDC’s tally of C-19 deaths may be modestly inflated but still provides a reasonable measure of the pandemic’s severity.
Correct answer given by 32% of all voters, 36% of Biden voters, and 27% of Trump voters.
Question 2: In your estimate, what portion of people who catch Covid-19 and are aged 70 and above survive from it? About half, about 75%, or about 95%?
Correct Answer: About 95%
In September 2020, the CDC published age-specific estimates for Covid-19 infection fatality rates, or the “number of individuals who die of Covid-19 among all infected individuals (symptomatic and asymptomatic).” The best estimate for this figure among people aged 70+ was 5.4%, which equates to a survival rate of 95%.
That rate was confirmed a month later by a study in the journal Clinical Infectious Diseases which found that Danes aged 70 and above had a C-19 infection fatality rate of 5.4%. The study also found that only half of elderly blood donors in Denmark who had antibodies for C-19 “reported having been sick since the start of the pandemic.” This indicates that the C-19 asymptomatic rate for elderly blood donors—who are typically healthy—is about 50%.
Furthermore, an August 2020 paper in the journal Cell found that the number of people who have had C-19 is “probably significantly higher than antibody tests have suggested.” This means that the asymptomatic rate for healthy elderly people is even greater than 50%.
The World Health Organization and many media outlets have published figures for C-19 death rates that were based only on reported infections. Given high numbers of asymptomatic and other unreported cases, those figures grossly undercount the number of people who have had C-19 and make the death rate seem much worse than reality.
Correct answer given by 27% of all voters, 15% of Biden voters, and 40% of Trump voters.
Question 3: Do you think Covid-19 is more or less contagious than the seasonal flu?
Correct Answer: More
A meta-analysis of 12 studies that assessed the contagiousness of Covid-19 in different nations found that its basic reproduction number (the primary measure of contagiousness) “ranged from 1.4 to 6.49,” with an average of 3.28 and a median of 2.79.
In comparison, a 2014 paper in the journal BMC Infectious Diseases analyzed 24 studies of the seasonal flu and found that the median result for its basic reproduction number was 1.28. The authors stressed that the seemingly small difference between 1.28 and higher figures like 1.80 “represent the difference between epidemics that are controllable and cause moderate illness and those causing a significant number of illnesses and requiring intensive mitigation strategies to control.”
On March 3, 2020—two weeks after the above meta-analysis was published—the Director-General of the World Health Organization gave a press conference in which he stated that “Covid-19 spreads less efficiently than flu.” In spite of this and other misinformation spread by the World Health Organization, Google/YouTube adopted a policy of censoring people who post content “that contradicts the World Health Organization (WHO) or local health authorities’ medical information about Covid-19.”
Correct answer given by 69% of all voters, 91% of Biden voters, and 46% of Trump voters.
Question 4: In which of the following states do you think the greatest portion of the population has died from Covid-19? Florida, New Jersey, or Texas?
Correct Answer: New Jersey
Throughout the Covid-19 pandemic, the states with the highest portions of their populations killed by C-19 have been New York and New Jersey.
Nonetheless, many media outlets have showered praise on the governors of those states for their handling of the pandemic while vilifying the governors of states with significantly better outcomes like Florida and Texas:
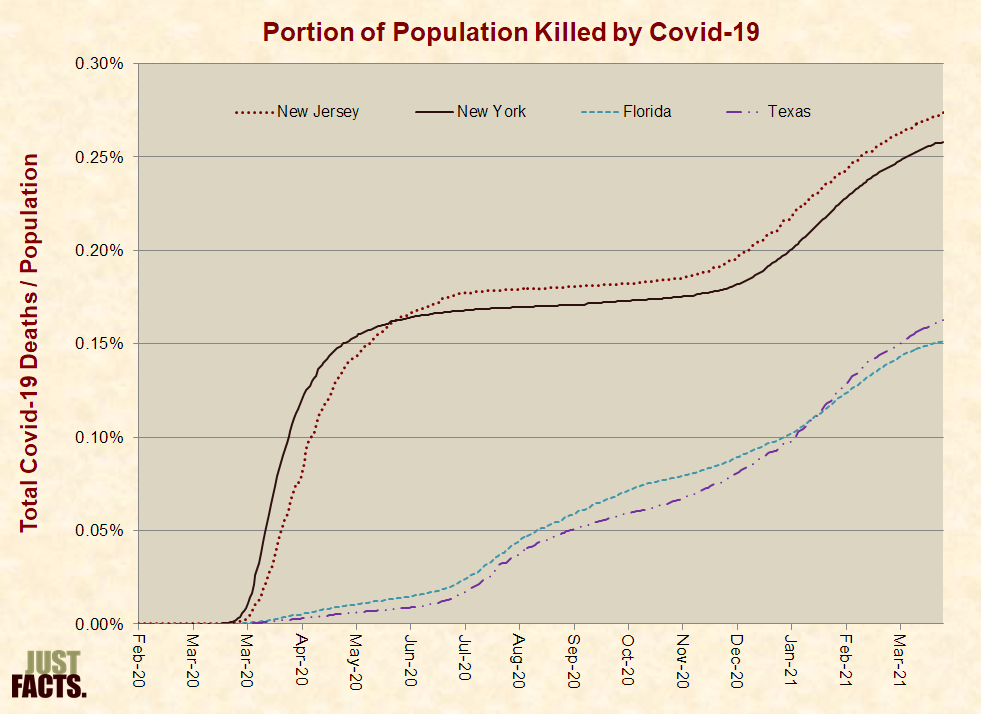
Beyond the political implications of misinforming large portions of the electorate, such journalism can draw attention away from serious problems and lead people to false conclusions about how best to protect their health and lives.
Correct answer given by 39% of all voters, 27% of Biden voters, and 53% of Trump voters.
Income, Wealth & Poverty
Question 5: Now, changing the subject from Covid-19 to people’s incomes, do you think that middle-income people in the U.S. have a higher or lower average standard of living than middle-income people in other wealthy nations like Britain, Canada, and Sweden?
Correct Answer: Higher
According to the latest complete data (2010), middle-income people in the U.S. have a higher standard of living than every other nation in the world. This is measured by their consumption of goods and services, the “preferred welfare indicator” of the World Bank.
Importantly, this measure accounts for all private, government, and nonprofit goods and services. Also, it is adjusted for purchasing power to measure tangible realities like square feet of living area, healthcare services, smartphones, etc. Thus, an apple in one nation is counted the same as an apple in another.
Contrary to a popular New York Times video that called the USA the world’s “poorest” developed nation, even the poorest 20% of U.S. residents consume more goods and services than the national averages for all people in most affluent nations. This includes the majority of countries in the prestigious Organization for Economic Cooperation and Development, such as Denmark, Japan, Portugal, and New Zealand.
Correct answer given by 45% of all voters, 27% of Biden voters, and 67% of Trump voters.
Question 6: If the federal government doubled the minimum wage, how much do you think this would increase the average income of families below the poverty line? About 1%, about 25%, or about 50%?
Correct Answer: About 1%
The Congressional Budget Office has estimated that doubling the federal minimum wage from $7.25 to $15.00 an hour would raise the average income of families below the poverty line by $589 per year. This is roughly 1% of their total income.
Some of the primary reasons why the increase is so low are as follows:
- The vast bulk of people in poverty work very little or not at all. In 2018, only 27% of adults in poverty were in the labor force for at least half of the year. This includes part-time workers and those who were simply looking for work.
- The Congressional Budget Office estimates that doubling the minimum wage would destroy about 1.4 million jobs, and many of these would be lost by poor people. This is because “when the cost of employing low-wage workers goes up,” some employers will replace them with machinery, technology, and higher-wage workers.
- The total income of households in poverty is several times greater than commonly reported. The poverty/income statistics widely used by governments and media outlets exclude many goods and services that poor people receive from governments and charities, like free health insurance, Food Stamps, housing, utilities, preschool, college, and cell phones.
Correct answer given by 21% of all voters, 8% of Biden voters, and 37% of Trump voters.
Question 7: In your view, did the average income of middle-income households rise or fall during the Obama administration?
Correct Answer: Rise
During the Obama administration, the average income of middle-income households rose from $71,900 in 2009 to $77,200 in 2016, or by $5,300. These figures, which come from Congressional Budget Office data, are adjusted for inflation and include all income sources such as wages, salaries, capital gains, rental income, and untaxed government and employer-provided benefits like food stamps and health insurance.
Association does not prove causation, so this rise in income cannot be objectively credited to Obama. However, Republicans routinely criticized the economy during the period of Obama’s tenure when incomes rose.
Politicians, media outlets, and scholars often quote incomplete measures of income that give false impressions about income trends and inequality.
Correct answer given by 45% of all voters, 79% of Biden voters, and 9% of Trump voters.
Question 8: On average, do you think that men and women in the U.S. earn equal pay for equal work?
Correct Answer: Yes
On average, full-time, year-round female workers earn about 23% less cash wages than males, but when the following six factors relating to equal work and pay are taken into account, the gap evaporates:
- Full-time male workers average 8% more workdays per year and 8% more workhours per workday than full-time female workers.
- Men are more likely to pursue technically demanding and higher-paying careers, such as computer science, finance, and engineering.
- Women are more apt to take jobs that offer higher fringe benefits in exchange for less cash wages.
- Women are more likely to temporarily leave their careers to raise a family, resulting in less work experience and continuity.
- Women are more apt to choose jobs with shorter commutes over those with higher pay.
- More than 28% of U.S. workers are in physically challenging occupations (like construction), and most men have considerably more muscular strength than most women.
Media outlets repeatedly ignore those facts and misportray the gender earnings gap as “unequal pay” for “equal work.” This stokes hostility, slanders employers, and cultivates victim mentalities that prevent people from reaching their potential.
Correct answer given by 27% of all voters, 5% of Biden voters, and 53% of Trump voters.
Racial Issues
Question 9: What portion of all murder victims in the U.S. do you think are comprised of the 13% of the population that is black? About 10%, about 25%, or about 50%?
Correct Answer: About 50%
Roughly 53% of all murder victims in the U.S. are black, even though black people comprise about 13% of the U.S. population.
Contrary to the media’s focus on interracial violence, roughly 11% of all murders in the U.S. are interracial. The other 89% involve people of the same races slaying one another.
Correct answer given by 34% of all voters, 28% of Biden voters, and 42% of Trump voters.
Question 10: In your view, are police more likely to use lethal force when arresting black people than white people?
Correct Answer: Less
Consistent with a 2018 study published in an academic journal, a 2016 study of arrest data by the left-leaning Center for Policing Equity found that police are 42% less likely to use lethal force when arresting black people than when arresting whites.
However, the authors of the study buried this data on the 20th page of their report and did not mention it in their summary or conclusion. The Washington Post then cited the study as proof of police brutality towards blacks.
Contrary to media storylines that exploit anecdotes, half-truths, and outright falsehoods, black and white people are typically arrested, prosecuted, and sentenced at rates that accord with the frequency and severity of their criminality. A notable exception to this is murder because blacks are much more likely to get away with this crime than whites. This harms black communities because the killers remain free to commit more carnage.
Correct answer given by 39% of all voters, 7% of Biden voters, and 77% of Trump voters.
Question 11: Which of the following racial/ethnic groups do you think is least likely to be pulled over by police for a traffic stop? Black, Hispanic, or white?
Correct Answer: Hispanic
In 2015 (latest data), 7.6% of all Hispanic drivers were pulled over in a traffic stop, as compared to 8.6% of all white drivers, and 9.8% of all black drivers.
While ignoring the fact that Hispanics are pulled over at the lowest rate, many media outlets and activists have cited the higher traffic stop rate of black people as proof of police discrimination. However, such statistics don’t account for the rates that people of different races engage in behaviors that lead to traffic stops, such as speeding or driving with an expired license plate.
For example, a study published by an academic journal in 2007 found that black drivers on the New Jersey Turnpike were more likely to be pulled over, but “police stop rates matched very closely the rates at which drivers exceeded the speed limit by 15 mph.”
Correct answer given by 3% of all voters, 1% of Biden voters, and 5% of Trump voters.
Question 12: Would you say that school districts with high concentrations of minorities and poor children generally receive less funding per student than other districts?
Correct Answer: No.
A broad range of credible studies have found that school districts with higher portions of minority students spend about the same amount per student as districts with smaller portions of minorities. This includes studies conducted by the U.S. Department of Education (1996), Ph.D. economist Derek Neal (2006), the left-leaning Urban Institute (2008), the conservative Heritage Foundation (2011), the Brookings Institution (2017), and the academic journal Education Next (2017).
The Urban Institute study—which looks the furthest back in time—found that “differences in spending per pupil in districts serving nonwhite and white students are very small” since at least 1972.
Media outlets and politicians often allege that schools with high portion of minorities receive less funding per student, but such claims are rooted in studies that exclude federal education funding, which flows overwhelmingly to schools in low-income areas. The authors of such studies commonly bury this fact in their reports, thus misleading people who don’t carefully read them and giving cover to those who deliberately misrepresent them.
Correct answer given by 32% of all voters, 11% of Biden voters, and 54% of Trump voters.
Global Warming
Question 13: Moving to the issue of global warming, would you say that the earth’s average sea level has risen since the 1990s?
Correct Answer: Yes
Since late 1992, instruments on satellites have been collecting data that scientists use to calculate the average global sea level. These datasets show that the average global sea level increased by 2.0 inches between the 1990s and 2010s.
That finding is confirmed by data from local tide gauges, which measure the level of the sea relative to reference points on land. These show that the average global sea level has been generally rising since 1860 or earlier.
Correct answer given by 72% of all voters, 96% of Biden voters, and 45% of Trump voters.
Question 14: Again, thinking about the whole planet, do you think the total amount of land area on earth has declined since the 1980s?
Correct Answer: No
A study of satellite data published by the journal Nature Climate Change in 2016 found that from 1985 to 2015, the net amount of land area on Earth grew by about 22,400 square miles. The study also found that the net amount of coastal land area on Earth grew by about 5,200 square miles.
Although the average global sea level has been rising, manmade and natural factors have led to a net gain in land area since 1985 or earlier. As one of the study’s coauthors stated, “We expected that the coast would start to retreat due to sea level rise, but the most surprising thing is that the coasts are growing all over the world.”
Correct answer given by 27% of all voters, 7% of Biden voters, and 49% of Trump voters.
Question 15: Do you think that the average level of carbon dioxide in the earth’s atmosphere has risen since the Industrial Revolution in the late 1700?
Correct Answer: Yes
Since the outset of the Industrial Revolution in the late 1700s, the average level of carbon dioxide in the earth’s atmosphere has grown from 0.028% to 0.041%, or by about 47%.
Correct answer given by 86% of all voters, 96% of Biden voters, and 76% of Trump voters.
Question 16: Would you say that the number of strong-to-violent tornadoes in the U.S. has generally increased since the 1950s?
Correct Answer: No
Since the 1950s—as far back in time as data from the National Oceanic and Atmospheric Administration extends—the frequency of strong-to-violent tornadoes has slightly declined.
Some have claimed that tornados have become more common due to global warming, but as the National Oceanic and Atmospheric Administration explains, this is an artifact of “increased National Doppler radar coverage, increasing population, and greater attention to tornado reporting.”
In contrast, strong-to-violent tornadoes “would have likely been reported even during the decades before Doppler radar use became widespread and practices resulted in increasing tornado reports.” Thus, they are a more accurate and salient measure of U.S. tornado trends.
Correct answer given by 26% of all voters, 4% of Biden voters, and 50% of Trump voters.
Health
Question 17: Do you believe that contact with a toxic chemical is always dangerous, no matter what the level of exposure?
Correct Answer: No
As explained in the academic book Chemical Exposure and Toxic Responses:
Likewise, a teaching guide published by the American Society for Microbiology states:
Also, substances that have low immediate toxic effects generally have low cancer-causing effects.
Just Facts adopted this question from a study published by the journal Nature Chemistry in 2019. This survey found that only 9% of adults in eight European countries knew the correct answer.
Correct answer given by 31% of all voters, 24% of Biden voters, and 37% of Trump voters.
Question 18: At the current rate of drug overdose deaths in the United States, what is the average lifetime chance of dying from a drug overdose? About 1 in 100,000, about 1 in 1,000, or about 1 in 100?
Correct Answer: About 1 in 100
More than 70,000 people were killed by drug overdoses in 2019. If this rate continues, one in every 59 people currently alive in the U.S. will eventually die of a drug overdose.
Drug overdoses rob an average of about 38 years of life from each victim, and 88% of these deaths are unintentional.
Since 1999, drug overdose death rates in the U.S. have risen by 3.5 times. This occurred while policies that were supposed to decrease these deaths were broadly enacted, such as legalizing marijuana and Obamacare’s mandate that health plans cover treatments for substance abuse.
Correct answer given by 21% of all voters, 21% of Biden voters, and 20% of Trump voters.
Question 19: Do you think average life expectancy in the U.S. rose or fell in the five years following the implementation of Obamacare?
Correct Answer: Fell
In the five years after most provisions of Obamacare were implemented in 2014, average U.S. life expectancy fell by 0.1 years. This is the largest five-year decline since World War II and runs contrary to the modern norm of rising lifespans, which increased by an average of 0.8 years every five years from 1960 to 2013.
Association does not prove causation, so this decline cannot be objectively blamed on Obamacare. However, supporters of the law routinely used such associations to promote Obamacare and to impugn the U.S. healthcare system. They also claimed that Obamacare would be “an absolute game changer” for substance abuse, but drug overdose deaths accelerated in the wake of the law.
Correct answer given by 23% of all voters, 15% of Biden voters, and 35% of Trump voters.
National Debt
Question 20: Changing the topic from physical health to economic health, do you believe there’s ever been a time in the history of the United States when the national debt was a larger portion of the nation’s economy than it is now?
Correct Answer: No
In May 2020, the U.S. national debt hit 120% of the nation’s annual economic output, breaking a record set in 1946 for the highest level in the history of the United States. The previous extreme of 118% stemmed from World War II, the deadliest and most widespread conflict in world history.
The national debt has since continued to grow and is currently 134% of annual U.S. economic output. This is 4.3 times its average level over U.S. history.
Economists and government agencies often measure government debt as a portion of annual economic output. This accounts for population growth, some effects of inflation, and the relative capacity of governments to service their debts. However, government agencies and media outlets often exclude a major portion of the national debt when reporting on it, and this can mislead people to believe that today’s debt is not the highest it has ever been in the nation’s history.
Correct answer given by 60% of all voters, 68% of Biden voters, and 55% of Trump voters.
Question 21: Since the 1960s, what do you think has been the main cause of rising national debt? Military spending, social programs, or tax cuts?
Correct Answer: Social programs
Media outlets frequently blame the rising national debt on tax cuts and military spending, but federal tax revenues have stayed at a roughly level portion of the U.S. economy for the past 80 years, and military spending has plummeted from 55% of all federal expenses in 1959 to 18% in 2019.
In reality, the primary driver of the national debt is social programs—which have grown from 20% of all federal spending in 1959 to 62% in 2019. Social programs are those that provide healthcare, income security, education, nutrition, housing, and cultural services.
Comprehensive data on federal social spending is not yet available for 2020, but in 2020 and early 2021, federal politicians enacted six “Covid relief” laws that will spend about $5.3 trillion over the course of a decade, mainly on social programs. This is more than the entire federal budget in 2019.
Correct answer given by 39% of all voters, 10% of Biden voters, and 74% of Trump voters.
Methodology and Full Results
The survey was conducted by Triton Polling & Research, an academic research firm that serves scholars, corporations, and political campaigns. The responses were obtained through live telephone surveys of 1,000 likely voters across the U.S. during November 4–11, 2020. This sample size is large enough to accurately represent the U.S. population. Likely voters are people who say they vote “every time there is an opportunity” or in “most” elections.
The margin of sampling error for all respondents is ±3% with at least 95% confidence. The margins of error for the subsets are 5% for Biden voters, 5% for Trump voters, 4% for males, 5% for females, 9% for 18 to 34 year olds, 4% for 35 to 64 year olds, and 5% for 65+ year olds.
The survey results presented in this article are slightly weighted to match the ages and genders of likely voters. The political parties and geographic locations of the survey respondents almost precisely match the population of likely voters. Thus, there is no need for weighting based upon these variables. The complete weighted and unweighted results are available here: